language

Carbon Footprint of Nations

Show me
footprint of
Play
Info Go fullscreen Go out of fullscreen
100000
50000
20000
10000
1000
100
10
0
No Data
1000
500
100
50
10
5
1
0
No Data
50
20
10
5
1
0.01
0.0001
0
No Data
Metric ton CO2
Metric ton CH4
Metric ton N2O
Illustration

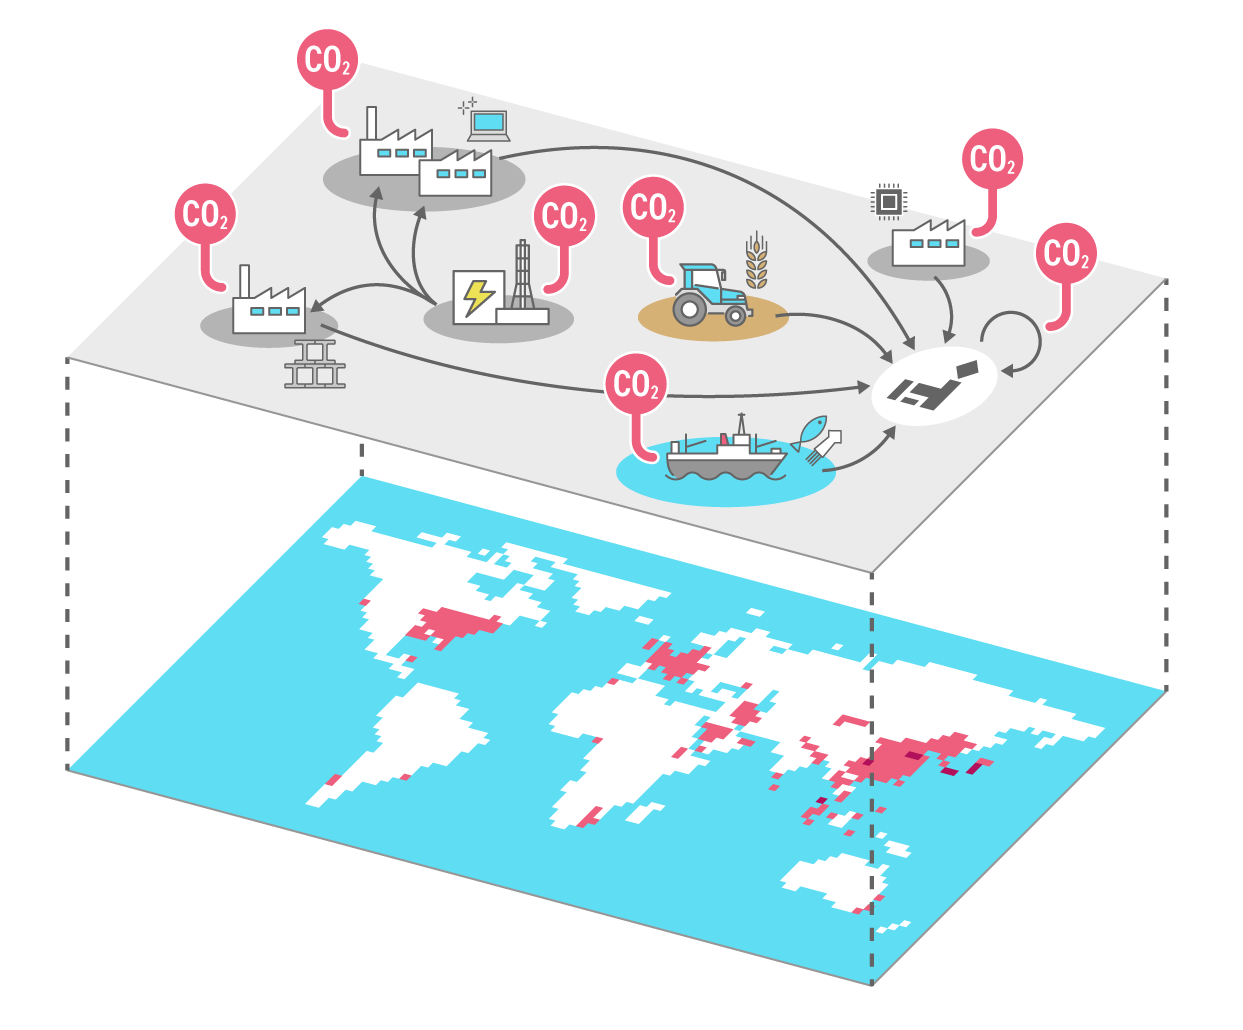
A map shows the carbon footprint of nations. We can observe the shift and growth in carbon footprint hotspots between 1970 and 2008.

Source: Keiichiro Kanemoto, Daniel Moran, Edgar Hertwich. "Mapping the Carbon Footprint of Nations" Environmental Science & Technology, 50(19), pp.10512–10517, 2016

1970
2008
Embodied emissions in imports, indexed (1970=1)
Filters